Related Categories
Related Articles
Articles
Nikkei 225
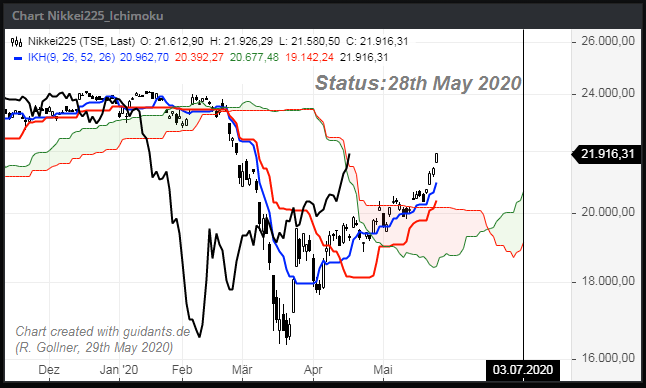
(Ichimoku-Status as per 28th May 2020)
The Ichimoku Kinko Hyo indicator was originally developed by a Japanese newspaper writer to combine various technical strategies into a single indicator that could be easily implemented and interpreted. In Japanese, "ichimoku" translates...

..."one look" meaning traders only have to take one look at the chart to determine momentum, support, and resistance.
The Ichimoku indicator is best used in conjunction with other forms of technical analysis despite its goal of being an all-in-one indicator.
Some more details: Ihe indicator is calculated on a weekly basis and the numbers in the legend above stand for the duration of the calculated numbers used for the formulas:
52 weeks in the year (52)
26 = half of the year (26)
9 = should be a magic number for Japanese people (9)
The current status as can be seen in the chart above; Interpretation, how bullish the current status is:
1. Price above the cloud: LONG
2. Cloud green (Senkou A above Senkou B): LONG
3. Price above Kijun: LONG
4. Tenkan above Kijun: LONG
5. Chikou above its candle and above the cloud: LONG
The japanese Stock Market-Index NIKKEI 225 is convincing Investors with 5 of 5 Long-Signals und is looking even stronger than its counterparts from Europe and the USA (Status as per 28th May 2020).

Conclusion:
The stock markets in Germany, USA and Japan are convincing with stable upward-trends - following the Ichimoku-Trend following system.


