Related Categories
Related Articles
Articles
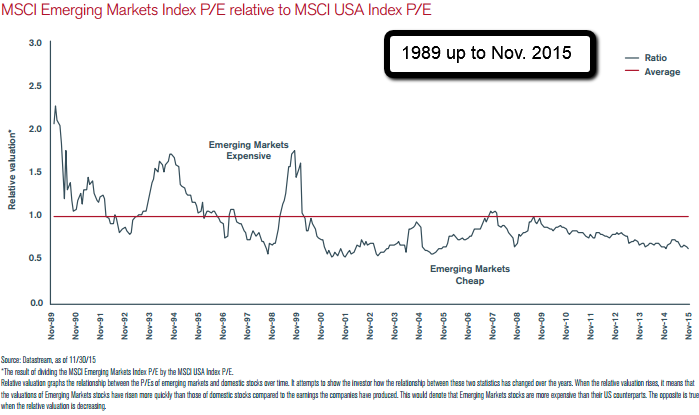
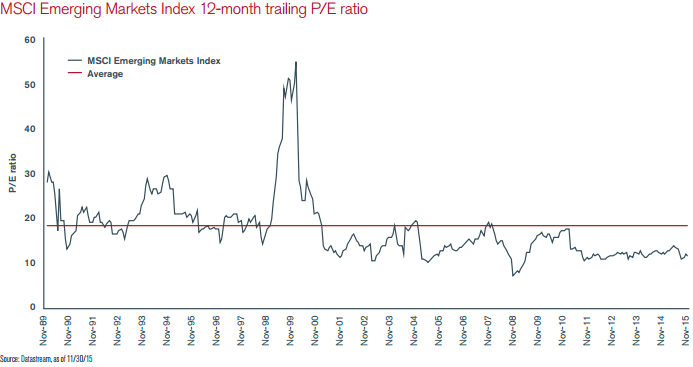
EM Valuation (1989 - 2015)
Valuations of EM equities are currently more attractive than they generally have been in the last two to three decades. Looking back at the last 10 years, the average price-earnings ratio for these assets was around 10-11.

In the last 25 years, the PE-ratio in the EM-space has only fallen below 10 on six occasions and in each of these cases robust price increases cumulating well over 100% were registered in the subsequent five years.

Analysis by JPMorgan Asset Management shows that the benchmark MSCI EM index was trading on a price/book ratio of 1.28 as of late August 2015 (see next chart ), suggesting that even if a company went bankrupt, investors would get back almost 80 per cent of their money by selling the underlying assets. EM-Price-to-book ratios have rarely been lower since 1995.
This ratio is now below the troughs witnessed during the global financial crisis and has only been lower twice in the past 20 years: fleetingly after September 11, 2001 and more tellingly during the 1997-98 Asian financial crises.
If one assumes emerging markets are not in as bad shape as in 1997-98, which still remains the mainstream view despite the gathering gloom, this might suggest EM stocks are now temptingly cheap.
“Emerging markets have only been this cheap 3 per cent of the time since 1989. Now is not the time to become more negative on the asset class,” says Richard Titherington, chief investment officer, emerging markets and Asia Pacific equities, at JPMorgan AM.
Tom Becket, chief investment officer at PSigma Investment Management, has also noticed the temptingly cheap price/book ratios. Yet, looking specifically at Asia ex-Japan, he notes that on each of the four times the p/b ratio has fallen below 1.3 over the past 20 years it has carried on sliding for a while before perking up.
The trough reached as low as 0.94 in August 1998, although subsequent nadirs were less extreme at 1.19 in September 2001, 1.22 in March 2003 and 1.23 in February 2009.
Number crunching from Credit Suisse based on these episodes shows, once the p/b ratio has fallen to 1.3, it has always been lower still both one month and three months later, although investors have always made money on a two-year view (so, let's recheck then this remark against the EM-Status in Aug. 2017 ;-).
“As an asset class, they have become so cheap relative to developed markets, relative to their history and relative to their future growth potential. But we are of the view that you need to be very selective,” Mr Becket says.
There are, of course, other ways of valuing equities. Perhaps the most commonly used would be the cyclically-adjusted price/earnings ratio (Cape). Unfortunately, for emerging markets this measure only goes back to 2005, so it does not cover the 1997-98 crises.
The measure, usually referred to as Cape, was at its lowest during the depths of the global financial crisis, but current valuations are now approaching this nadir (see following chart):
Summary of EM-Report for March 2016 (source: RCM)
Naturally, it is impossible to make any forecasts for the future, especially since the global economy and financial market conditions have changed significantly in recent decades. Nonetheless, the emerging markets may have excellent potential if there are positive changes in the fundamental situation and investors’ perception. Of course, the key word here is “if”. From the current vantage point, the chances of such an improvement in the coming quarters look promising.
source: https://next.ft.com
.pdf/download: Henderson EM-Valuation sheet (.pdf)
.pdf/download: https://www.rcm.at


