Related Categories
Related Articles
Articles
Post vom 2. April 2007
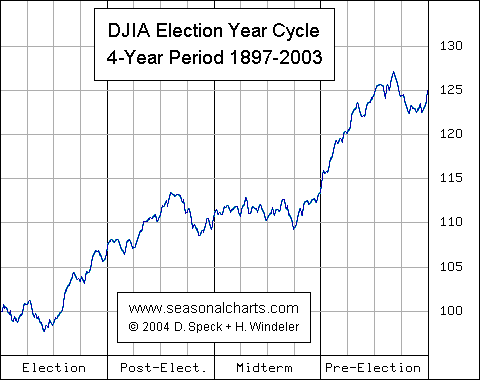
In the section 4-Year Election Cycles SeasonalCharts.com examined a four-year instead of the typical one-year cycle. The chart shows the average course of prices over a total four-year period.
The four-year cycle is determined by the US presidential election. 2004 was an election year. We have 2007 and the cycle years are:
2004: Election Year
2005: Post-Election Year
2006: Midterm Year
2007: Pre-Election Year
The course of important US markets is largely dependent on whether the current year is an election year or one of the three cycle years following an election. Stocks tend to see an above average increase during the year preceding an election year. The reason for this development is assumed to economic policy before an election. Increasing stock prices and a booming economy sheds positive light on the incumbent political party.
But not only stocks are influenced by the US election cycle. Interest rates and currencies can also be affected. Through the dominance of the US capital markets, international markets are also influenced by the election cycle including the German stock market.

P.S.
Damals habe ich die Meldung von T. Grüner vom 3. Dezember 2002 gepostet; der S&P 500 legte daraufhin im damaligen Pre-Election Year 2003 mehr als 25% zu ;-)


