Related Categories
Related Articles
Articles
S&P 500 possibility for Year-End-Rally?
Before making any conclusion take a look @ the DJ-Transportation-Index and see (wait?), IF the daily Index-close will reach a level ABOVE the EMA-200 line in the chart below:
As the chart is updated automatically on a daily basis - one should stay tuned! (As per 20th Oct. 2015 the level of the EMA-200 daily is/was @ a level of ca. 8,320 in the DJT-Index; Already in August 2015 the Moving Average served as an important line/resistance, maybe the EMA-200 can be broken through in the near future - therefore THEN leading to a bullish BUY-Signal)
Seasonality taken from the 20-year timeframe 1994 up to 2014 leads to following outcome (see graph from equityclock.com below); 20th October up May 2016 (straight upmove?), CHANCES NOW 50:50 ?

This evolution does not take into account the famous 7-year cycle (since according to that comparison 2015 and also 2016 should go through a bumpy road according to that graph, which can be found also under equityclock.com). Calculating away from ca. 2,030 (SPX as per 20th Oct. 2015) a rise of ca. 4% would lead to a level of ca. 2,110 as per New-Years-eve 2015.
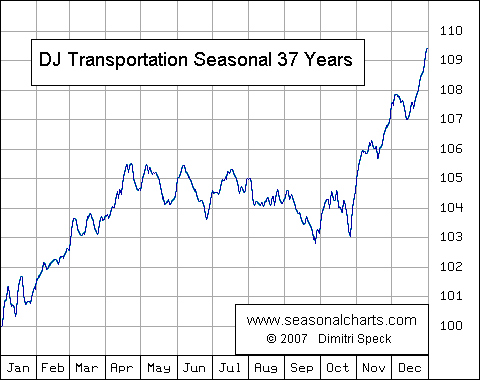
As mentioned upfront: Without the help of the transportation-stocks this will be a hard attempt. But as can be seen from the seasonality-chart of the DJ Transportation Index (37years frame 1970 up to 2007 - BEFORE the financial crisis in 2008!) the transportation stocks may (!!) get seasonal tailwind and apart from that eventually lower oil-costs may serve as the fundamental foundation for that development:
source: http://www.seasonalcharts.de


