Related Categories
Related Articles
Articles
Magic 536-level in the Value Geom. Index
The Value Line Geometric Index (VALUG) consists of about 1,675 U.S. stocks. This gauge from investment-research firm Value Line gives equal weight to each of its components, while the S&P is market-cap weighted and the Dow is price weighted.
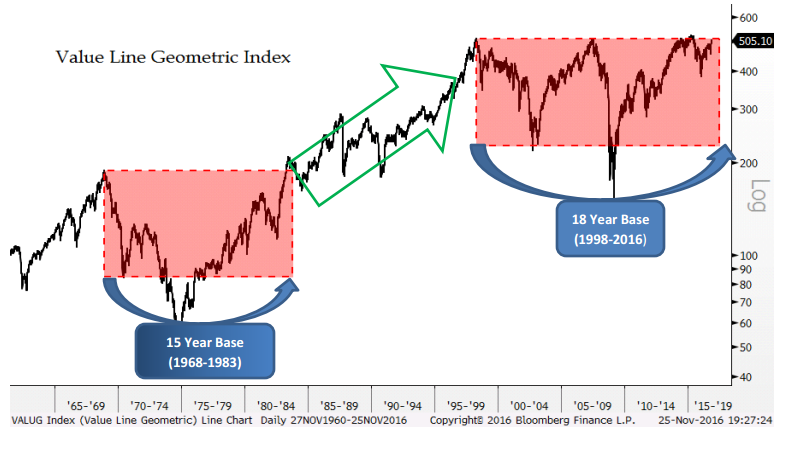
 The Value Line Geometric Index assumes an equal dollar investment in every security and is re-balanced daily. In the following chart you can see the tough times the Index and its investors had to stomach since the year 2000, in order to reach a level of ca. 515 now / near its ALL-TIME-HIGHS:
Geometric averaging provides a realistic representation of what the 'average stock' is doing. Value Line’s benchmark wasn't setting records in November 2016, even as the S&P, Dow and other better-known indexes leapt to new highs. It instead continued to wrestle with milestones from the late 1990s.
Remarkably, despite the SPX and DJIA well above their 2000 highs, the 'VALUG' index is still attempting to exceed levels seen in 1998!
full article: www.marketwatch.com/story


