Related Categories
Related Articles
Articles
1954, -58, -85, -89 (S&P 500 in 2020?)
years 1954, -58, -85, -89 (S&P 500 in 2020?)
US-Stock Market History
With an open mind and the current FED-Policy one even has to think about the "unthinkable". Let's take a look at similar historical "Advance/Decline Breadth"-Trends on a monthly basis and the year after - the...
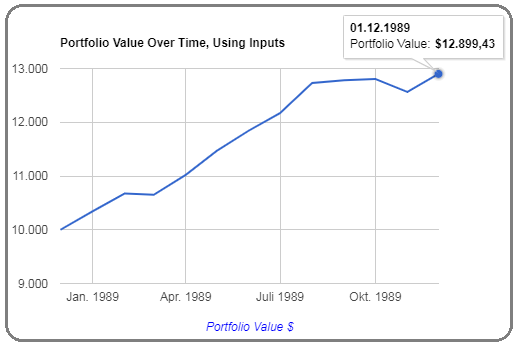
year 1989
In the year 1989 an investment of USD 10k would have gone up to USD 12,899
...same occurence like we were just experiencing now in Q4-2019.
year 1985

year 1958

...and last but not least, one of the first "easy" years of Mr. Buffet, 1954:

Charts created by Ralph Gollner via https://dqydj.com
"based on the analysis of two consecutive monthly breadth closes above upper Bollinger Bands"
Check out the basis for these chosen years/charts: https://youtu.be/EC7RbbYQi78


