Related Categories
Related Articles
Articles
Dow Jones (IA) Trendchannel 2011 onwards
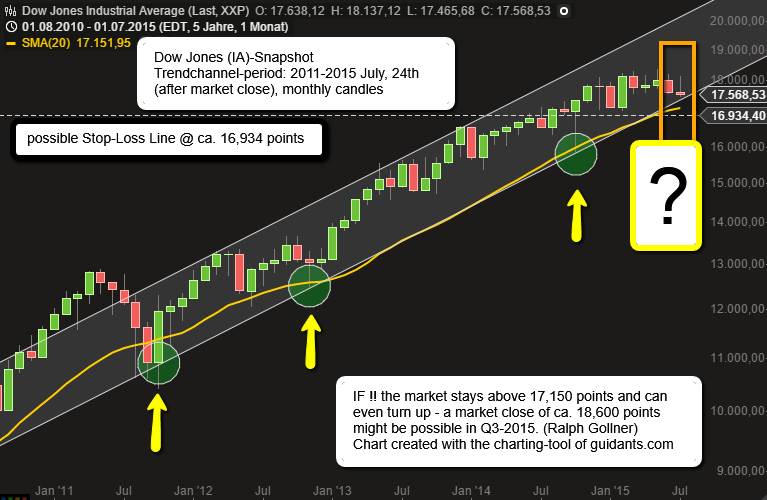
Dow Jones Industrial Average Trendchannel 2011 - 2015, 24th July (monthly candles)
Below a trendchannel of the famous Dow Jones (DJIA) from the starting point 2011 (the last time some real turmoil was going on especially in the European financial markets) up to now, 24th July 2015.

At this point now the market is (short-term) on the edge. As Q3 has the tendency to be a nervous period of the year one should rethink twice if one wants to reduce ones exposure now or even come back to the markets only again in mid-October (Q4) for a possible year-end-rally?


