Related Categories
Related Articles
Articles
Dow Jones Ind. Average @ 19k (>19k ;-)
What can happen, after the DOW breaks that magic "K"/ round 19,000-level (psychological TRIPPLE-ZERO-barrier)
Check out the video here (15th Nov. 2016):
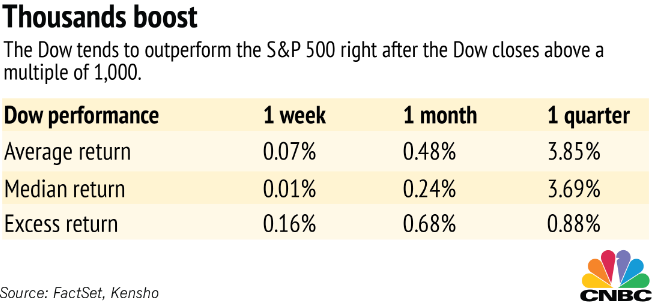
www.kensho.com/#/statsbox

Apart from that special issue on the tripple-zero-break (which I will turn back again in the lower part of this posting!) let's recap on the history of the "Dow": Over the 119 calendar years since the Dow Jones Industrial Average was created in the late 1800s, it has risen 65.6% of the time. Over the 119 calendar years since the Dow Jones Industrial Average was created in the late 1800s, for example, it has risen 78 times, or, 65.6% of the time. Whenever the market rose during a given year, its odds of rising the next year were a virtually identical 65.4%. Following years in which the market fell, in contrast, its odds of rising the next year were 65.9%.
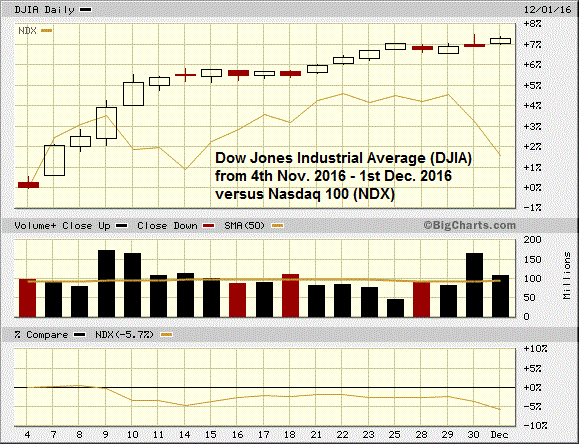
In the following chart please check out the divergence between the Dow Jones Industrial Average versus the Technology-Sector-Index, aka NASDAQ-100 in the timeframe 4th Nov. 2016 up to 1st Dec. 2016 - and compare it with the statistics-box above.

Let's recap now on the magic 19,000-break in the Dow. Based on market data from the past 30 years, when the Dow has crossed levels like 2,000, 3,000, 4,000 ... all the way to 18,000, we can expect traders to push it up even higher, according to data from Kensho. The Dow doesn't just go up, but it outperforms the S&P 500 along the way.
The trend is true not just for a quick one-week return, but also one-month and one-quarter returns. Grasping the power of the full data, going back to January 1987, when the Dow closed above 2,000 for the first time can be analysed on 17 different instances, all the way through the first close above 18,000 in December 2014.
On a one-month basis, the Dow has outperformed the S&P 500 13 of the past 17 past times. Those Tripple-Zero multiples get extra attention in the media (as this article demonstrates), encouraging more people to jump on board. Such mental and optical effects also relate to technical trading, where investors focus on chart movements and specific levels of "support" and "resistance." Breaking through any -000 number is a real event that people can flock toward to push assets higher.
A market move through a -000 level also suggests a shift on the chart: Levels that had been considered resistance - psychological barriers against going higher - turn into levels of support - barriers against dropping lower. Consider the scenario we are in: A Dow below 19,000 is still pushing on that ceiling, but once it breaks above 19,000, it just has blue sky and room to run.
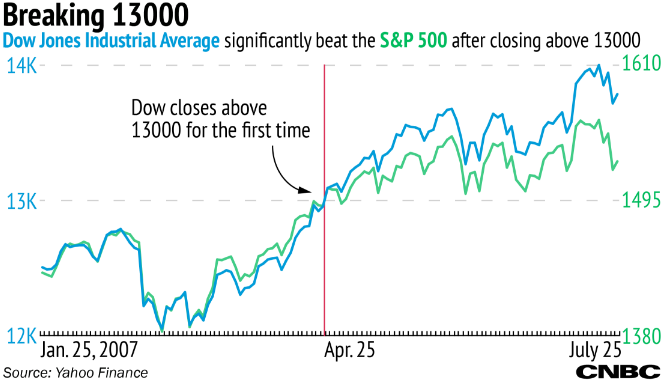
Take a look at one example from mid 2007, when the Dow closed above 13,000 for the first time. You'll see specifically how the Dow then took off relative to the S&P 500, outperforming by almost 4 percent in just three months:

In the last section of this posting I am posting the daily chart/candlesticks incl. daily trading volume (daily updated !) of the Dow Jones Industrial Average - timeframe covered: the last 3 months (incl. 90-day Moving Average):
Have Fun with all these straight-forward statistics and keep on (machine-) learning !
links:


