Related Categories
Related Articles
Articles
Dow Jones Industrial Average
27th Dec. 2016 - March 2017 (future, yes ;-)
To be perfectly clear, nobody knows where the Dow Jones Industrial Average will be at the end of 2017. Even those who get it right will have made nothing more than a lucky educated guess...

For a start: I am happy with everything between 19,440 and 20,950 points in the first half year of 2017.
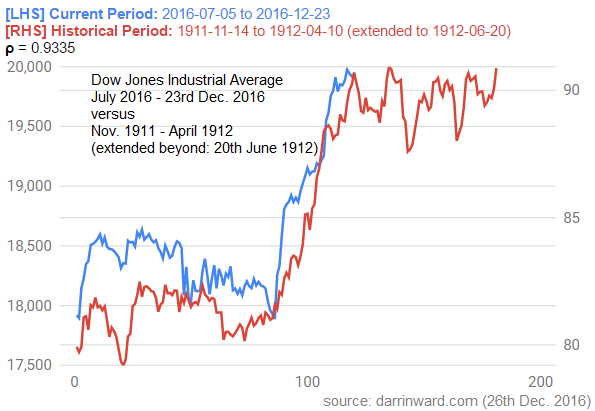
The Pearson correlation coefficient (here, see the "p-value" in the chart above) is used to measure the strength of a linear association between two variables, where the value r = 1 means a perfect positive correlation and the value r = -1 means a perfect negataive correlation. So, for example, you could use this test to find out whether people's height and weight are correlated (they will be - the taller people are, the heavier they're likely to be) - but...
...in this case here we make a weird test of comparing the buyers/sellers-power-thug-of-war in the Dow-Jones in the year 1911/1912 versus the 2nd half of the year 2016 ->> pretty "out-of-the-box-thinking" - hm?? Well, think about it this way: Volatility ist changing over decades, yes or no?!?...
How "we" calculated Correlation back in the stone-ages (great step by step - online-tool):
www.socscistatistics.com/tests/pearson
Some facts about the Dow Jones-components: www.topyields.nl/dow-jones-best-dividend-stocks
"back to the past" DJIA-data-set: www.idvbook.com/teaching-aid/data-sets/the-dow-jones


