Related Categories
Related Articles
Articles
Warren Buffet
Million % Plus...
What happens if you compound +20.5% (each year) over 54 years? well, you will achieve an overall gain of 2.472 Million percent. ( + 2,472,627%). By the end of 2018, Berkshire Hathaway stock had risen...

...by 2,472,627% (that's not a typo) in the 54 years since Buffett took control of the company.
Because of this phenomenal performance, it's often assumed that Buffett must have taken some big risks that paid off well but, surprisingly, this isn't the case. Every investment Buffett makes is done because the value makes sense, there's a low probability of loss, and the business has a bright future.
In the same period (1965 until 2018) the S&P 500 (Broad US-Stock Market index) gained 15,019 % (also not that bad).
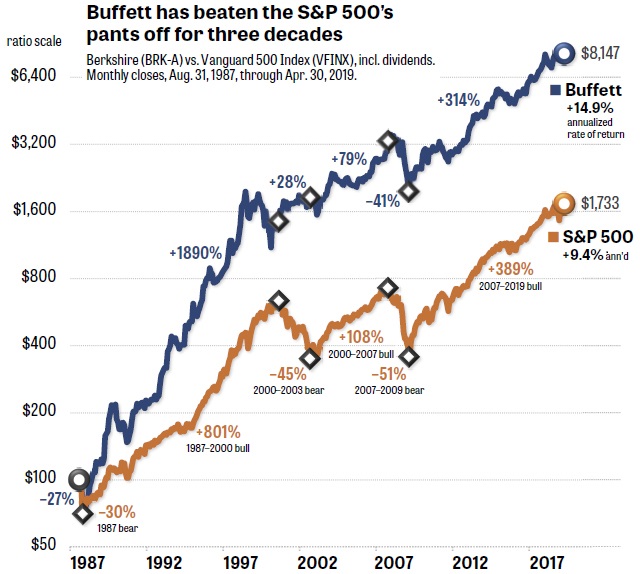
Graph above (Not a backtest, REAL Performance!):
The accompanying graph shows that the rise of Berkshire's share price in the past 32 years has been nothing short of phenomenal. Warren Buffett has done what few investors of any size have been able to accomplish: He has beaten the S&P 500, including dividends, for many decades and by many, many percentage points.
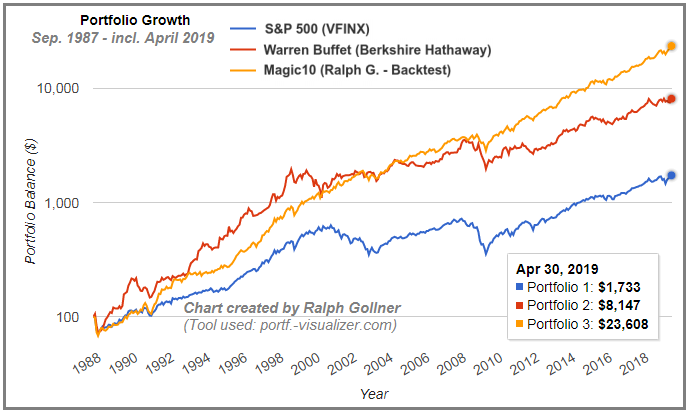
If you had purchased USD 100 worth of Buffett's stock, BRK-A, in August 1987, it would be worth more than USD 8,000 today. By contrast, USD 100 worth of the Vanguard Five Hundred Index mutual fund VFINX, +0.98%, which tracks the S&P 500, would hand you back only about USD 1,700 (the exact results can be seen again in the following chart / and Intro-chart above):

The S&P 500 index fund's annualised return of 9.4% would have made a healthy contribution to your portfolio, to be sure (with a few horrible crashes along the way). But Buffett's 14.9% return puts the index to shame. The graph assumes that you reinvested the dividends from the S&P 500. Buffett believes his shareholders want capital gains, not dividends, so Berkshire hasn't paid any out since 1967.
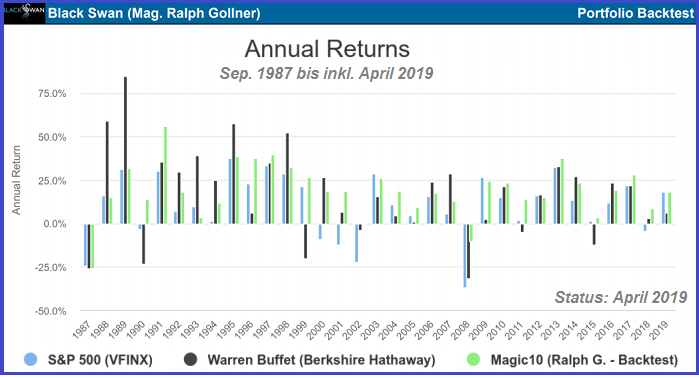
Each year plotted produces following bardiagram:

One remark:
In 1980, you could have bought one share of Berkshire Hathaway (Ticker: BRK-A) for a mere 260 bucks (USD 260). Today, a share will cost you over USD 300,000. Buffett had to set up a tracking stock in 1996, BRK-B, so small investors could buy shares for a tiny fraction of the big brother’s trading price.
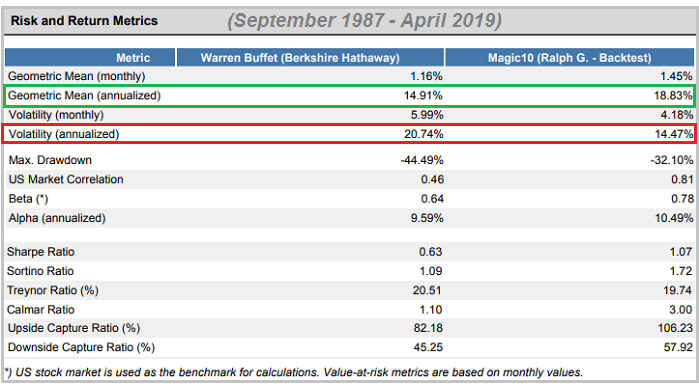
A Backtest of one of my "overfitted" (best-fitted ;-) portfolios against Mr. Buffet produced following metrics:

Another Reminder:
Berkshire lost ca. 41% in the 2007–2009 financial crisis, while the index (S&P 500) fell 51%. In the 2000–2002 dot-com debacle, when the S&P 500 collapsed 45%, Buffett actually pulled off a gain of 28%. Without loading up on tech stocks, his diversified portfolio continued making profits.
The company is only barely beating the S&P 500 in the current 2007–2019 bear-bull cycle, but so what? Buffett is, in fact, still beating the index, which most hedge funds (often charging unbelievable high fees!) and actively managed mutual funds can't claim.
links:
www.fool.com/investing/how-to-invest-like-warren
berkshire-Annual letter
www.berkshirehathaway.com/letters/2018ltr.pdf


