Related Categories
Related Articles
Articles
History 1923 - 2013
(Ned Davis Research)
This research-outcome helped me in surviving the stormy markets in the year 2015 and in the first 5 months of 2016. Dividends have been the lifeblood of long-term investors - helping them achieving high returns! year-over-year:

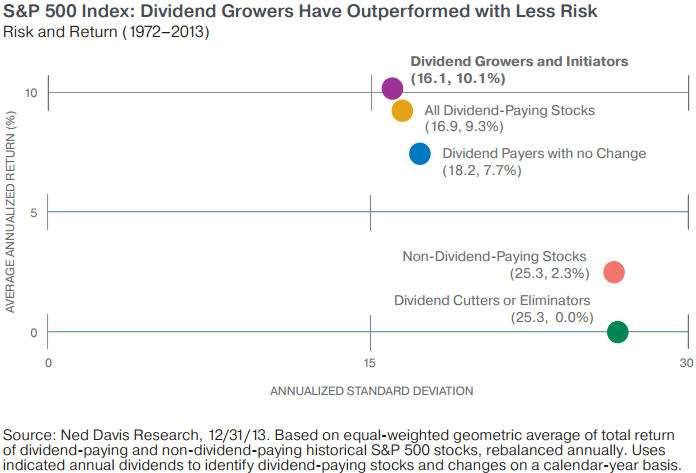
The performance shown represents the risk-return characteristics of each of the categories with annualized standard deviation (measure of risk) measured on the x-axis and the average annualized return measured on the y-axis. Risk is represented by standard-deviation, a statistical measure of the degree to which the performance of the portfolio varies from its average performance during a specified period. Generally the higher the standard deviation, the greater the volatility of the portfolio´s performance relative to its average return. It is calculated using historical period returns around a mean. The performance shown is for illustrative purposes only and does not guarantee future possible results.
♦From 1926 through 2013, dividends have represented nearly 43% of the returns generated by the stock market, as represented by the S&P 500 Index.
♦The chart above illustrates that outperformance - and shows how stocks of companies that grow and initiate new dividend payments outpaced other alternatives. What makes these results even more compelling is that stocks with growing dividends have not only outperformed, but have done so with less risk.
♦Common Sense Idea: If a stock you own reduces its dividend, it is paying you less over time instead of more. This is the opposite of what should happen. You must admit the business has lost its competitive advantage and reinvest the proceeds of the sale into a more stable business.
♦Evidence: Stocks that reduced or eliminated their dividends had a 0% return from 1972 through 2013.
link regarding the chart/information above:
http://www.suredividend.com/wp-content/uploads/2014/03/Rising-Dividends.pdf


