Related Categories
Related Articles
Articles
Jan. & Feb. UP in the S&P 500
(Status: 7th March 2017)
This bullish stock signal has never been wrong - and the Signal is green since 1st March 2017! CFRA's Sam Stovall notes one interesting indicator got triggered by the last trading day of Feb. 2017.
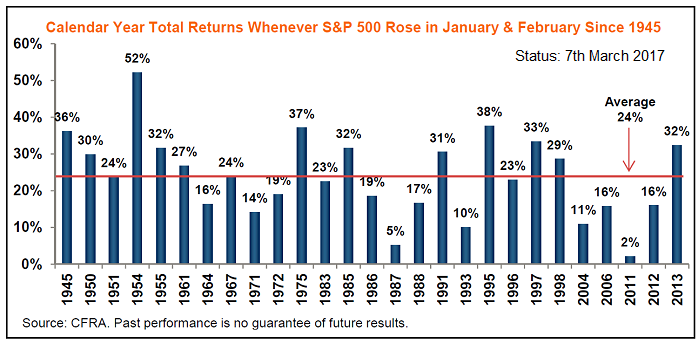
"If you need additional encouragement that a bear market is not just around the corner, history again offers some more virtual Valium," says Stovall. Since 1945, there have been 27 years when the S&P has achieved gains in January and February. The stock index then finished up for the year (on a total-return basis) in every one of those years, according to Stovall. That's going 27 for 27, or a batting average of 1,000 ("100 percent")!
The average rise in those years was 24%, as shown in the chart above, and the gauge was up further in the remaining 10 months 25 of 27 times. But - OF COURSE ! - remember that favorite Wall Street caveat: "Past performance is no guarantee of future results."
You want to read about another interesting fact, which may help for "anticipating" the upcoming months in 2017? Question: How was the INTRA-YEAR-evolution in some of these mentioned years? Well, I took a look at the monthly developments in the years 1995-1998, 2004, 2006 and 2011- 2013. Here are the results (Overlay of all thementioned years):


