Related Categories
Related Articles
- S&P 500 extrapolation April 2016 (May 2015)
- S&P 500 Short-term problems BELOW 2.067 (June 2015)
- S&P 500 (magic level: 2,131 points)
- S&P 500 support levels August 2015
- Biggest stock buyer in the US (2014/2015)
- Long-Term Trendlines (S&P 500)
- 5% weekly drop (historical breakdown since 1980)
- S&P 500 - neg. Aug. & Sep. - what follows next?
- S&P 500 (> 1.870 - level), 33-month average
- US-Industrial Production vs. S&P 500
- S&P 500 Index (Sectors), Fwd. PE-Valuation
- S&P 500 / PE-Ratio (Valuation)
- Post-Rate-Hike (Scenarios/History)
- Valuation S&P 500 @ 2,000 points (Price/Sales-Ratio)
- S&P500 after a possible (!?) rate hike
- Fed Rate Increase (16th Dec. 2015)
- S&P 500 & High-yield-bonds (correlation)
- S&P 500 @ 1.999,99 Punkten (4. März 2016)
- Quarterly Earnings and the US-Stock Market
- S&P500 Chartcheck nach ATH (HY2/2016)
- S&P 500 (Q2-2015 - 12th Aug. 2016)
- Sungarden Investment Climate Indicator (S&P 500)
- S&P 500 (Magic Longterm-Support: ca. 1.915)
- S&P 500 (Pros YE-Targets 2017)
- S&P 500 (magic 2.4k)
- S&P 500 ETFs (tiny insight)
- Periods prior Market Peaks (S&P 500)
- S&P 500 100-point gain(s)
- Kindergarden-Börse ("the 90s")
- S&P 500 ( > 2.500 Punkten)
- S&P 500 (SMA 255, SMA 200)
- S&P 500 Total Return (1998 - March 2018)
- S&P 500 (Möglicher Support bei 2.673 Punkten)
- S&P 500 (im Q4-2018)
- S&P 500-Indexlevel (magic 2.4k; Dec. 2018)
- S&P 500 (EMA200-weekly)-Support
- S&P 500 (Resistance-Levels), Jan. 2019
- S&P 500 - Kuzfristiger Seitwärtstrendkanal
- S&P 500 (Yearly Returns since 1950)
- 2.817 Punkte (S&P 500)
- S&P 500 @ 3k in Sep. 2019 (?)
- Magic GOLDEN CROSS (Jahr 2019)
- S&P 500 (2000 - Juni 2019)
- S&P 500 (NEW All-Time-High)
- S&P 500 > 3k (Status-Quo: 16. Dez. 2019)
- S&P 500 > 2.954 (No need to panic - YET)
- "COT-Report" (S&P 500)
- S&P 500 & Moving Averages (28, 30, 38)
Articles
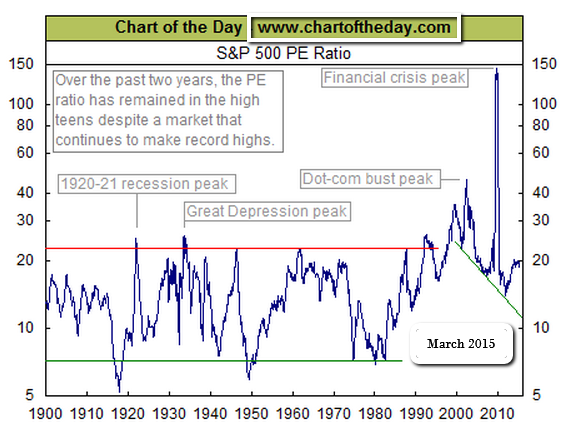
Valuation S&P 500 (March 2015)

2015-02-25 20:56:56


