Related Categories
Related Articles
Articles
S&P 500 / neg. Aug. & Sep. - what follows next?
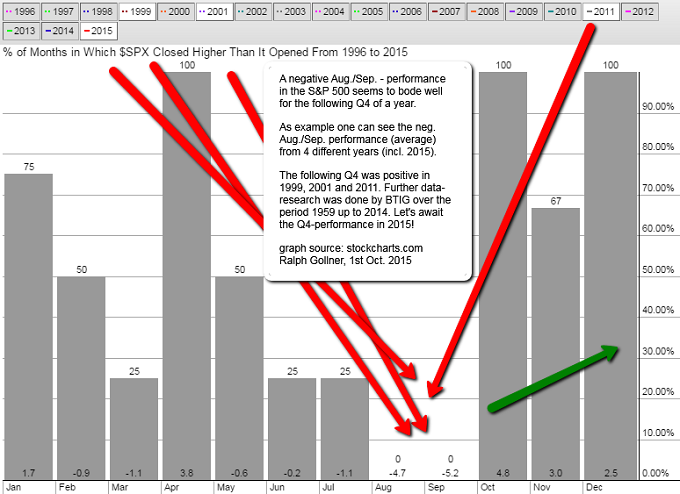
BTIG’s chief strategist Dan Greenhaus gives a good hint about a years' Q4 after a neg. Aug./Sep. period:
“Dating back to 1960, any non-2008 quarter down more than 2015’s Q3 saw the index appreciate 80% of the time in the following quarter,” he says in a note to investors, adding that the median gain was 5.5%.
Greenhaus looked at stats since 1959, making note of when August and September have been losing months for stocks. In all but one year — 1977 — the fourth quarter has ended higher each time, with a median gain of 7.9%.
In the following chart I extracted the S&P 500-results in selected neg. Aug./Sep.-years from 1996 onwards resulting in 4 years (incl. 2015):
+) Going through the statistics (shown under the following link) one can calculate a possible - "bad case" - lower level by 31st Dec. 2015 of ca. 1,890 points in the S&P 500.
-) Applying the median of the positve outcome-years under observation in the analysis would lead on the other hand to a level of ca. 2,070 as per 31st Dec. 2015. (S&P 500 close as per 30th Sep. 2015 was ca. 1,920 points)
link to original article and selected data from 1959 onwards: http://www.marketwatch.com


