Related Categories
Related Articles
Articles
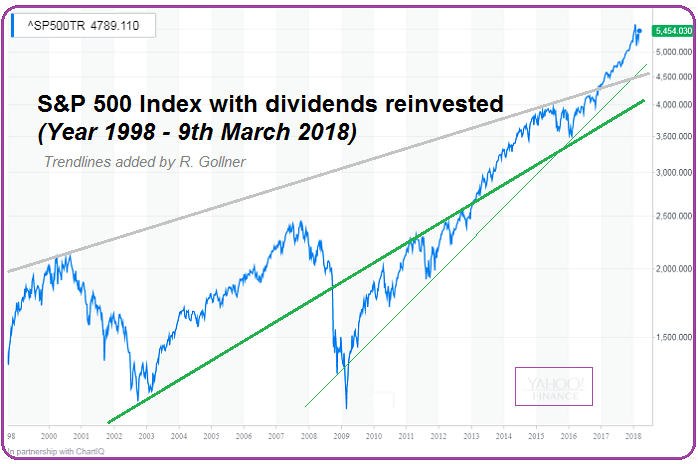
S&P 500 Total Return (1998 - March 2018)
S&P 500 incl. dividends (reinvested)
(Total Return - LT-Chart)
The financial meltdown of 2007 and 2008 began with a liquidity crisis in August 2007. From the pre-crisis closing high on 13th July 2007, through the closing bottom on 9th March 2009, the...

...S&P 500 (excluding dividends) dropped ca. 55%. In the chart above you can see, what the S&P 500 Total Return (therefore here Dividends ARE included) has done since then.


