Related Categories
Related Articles
Articles
Euro Area Economic Sentiment Indicator
Making Sense of The European Economic Sentiment Indicator (ESI)
The ESI is derived from surveys gathering the assessments of economic operators of the current economic situation and their expectations about future developments. The ESI is derived...

...from surveys gathering the assessments of economic operators of the current economic situation and their expectations about future developments. The ESI is a composite indicator made up of five sectoral confidence indicators with different weights:
♦ Industrial confidence indicator,
♦ Services confidence indicator,
♦ Consumer confidence indicator,
♦ Construction confidence indicator
♦ Retail trade confidence indicator.
The ESI is derived from surveys gathering the assessments of economic operators of the current economic situation and their expectations about future developments.
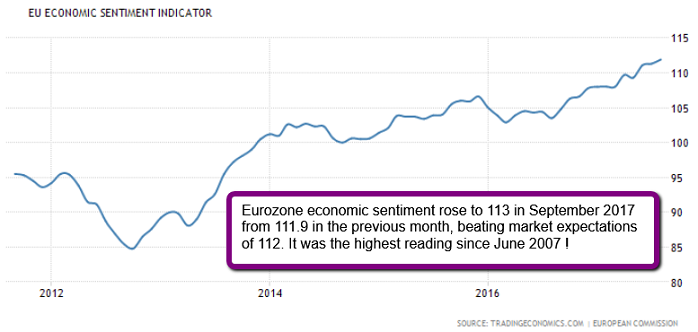
Eurozone economic sentiment rose to 113 in September 2017 from 111.9 in the previous month, beating market expectations of 112. It was the highest reading since June 2007, as sentiment improved among manufacturers (6.6 from 5 in August), service providers (15.3 from 15.1), retailers (3 from 1.6), constructors (-1.7 from -3.3) and consumers (-1.2 from -1.5). Economic Optimism Index in the Euro Area averaged 100.80 from 1985 until 2017, reaching an all time high of 119 in May of 2000 and a record low of 68.10 in March of 2009.
Currently the Indicator is safely above its 26-year average of 100.
links:
May 2017: https://seekingalpha.com/article
www.thenatureofmarkets.com/making-sense-of-the-european-economic-senti


