Related Categories
Related Articles
Articles
History 1988 - year 2017
Optimism about the short-term direction of the stock market has been below average for 40 out of 50 weeks this year in the famous AAII Sentiment Survey. Given this trend, AAII was curious as to how the year 2017 compares to the 30 previous years.

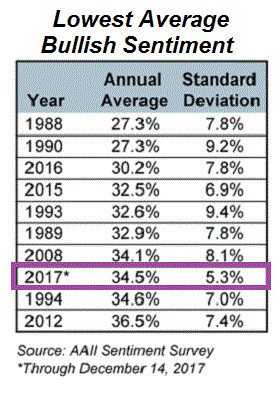
...tracked by the survey. So, AAII updated the historical analysis I've been keeping on unusually high and low readings (see the table) and then conducted calendar-year analysis.
Year to date, bullish sentiment is averaging 34.5% (including this week's latest reading of 45.0%). Historically, bullish sentiment has averaged ca. 38.5% over the life of the survey. Relative to the other 30 calendar years with survey data, 2017 ranks eighth in terms of having the lowest average bullish sentiment !
As you can see on the table, 1988 and 1990 had the lowest average levels of optimism at 27.3% each. Notably, in third and fourth place were 2016 and 2015. Not shown in the table are the years with the highest level of average bullish sentiment: 2000 (49.4%), 2004 (49.0%) and 2003 (48.4%).
While average bullish sentiment has not been exceptionally low this year (2017), its weekly readings have been comparatively stable. When calculating the standard deviation (a measure of variance) on a calendar-year basis, this year ranked as the 2nd-owest. The year with the lowest level of standard deviation was 1995, with a standard deviation of 5.2%. This year may actually be tied for the lowest because prior to 2000 the weekly readings were rounded to whole numbers.
Another detail for your information:
The year with the greatest variance in bullish sentiment was 2003. Bullish sentiment swung that year from a low of 21.1% on 20th February 2003, to a high of 71.4% on 26th June 2003. The big swing occurred as the post-dotcom bear market bottomed and stocks rebounded strongly. [This year (2017), optimism has ranged from 23.9% (18th May 2017) to 46.2% (5th January 2017).]
The calendar-year averages are interesting and provide some color, but where the AAII-Sentiment-survey has the strongest link with market returns is when sentiment reaches extremes. Specifically, when bullish sentiment falls to an unusually low level, the S&P 500 has historically outperformed. As history shows, the large-cap index has risen by an average of + 7.4% over the following six-month period whenever bullish sentiment has been more than one standard deviation below its
historical average. (important detail to know: Currently, a reading below 28.0% would be unusually low)
Conversely, whenever optimism is too high, stocks tend to underperform. The S&P 500 has realized an average six-month return of just 2.8% whenever bullish sentiment has been more than one standard deviation above its historical average. (Readings above 48.5% would be unusually high based on the current range.)
Despite suggestions for buying "when there’s blood on the streets," analysis of the AAII-survey's history suggests that buying when everybody else is gloomy about future returns is a better strategy. But well, one should not, however, base ones portfolio decisions off of anybody else's survey data. Though a link exists, it is not causal. Rather, you could use unusually high or unusually low bullish sentiment as a sign to check other factors (e.g., valuations) and to see if your portfolio needs to be rebalanced.


