Related Categories
Related Articles
- South Africa (May 2015)
- SMA200 - Standard deviations Indices (Okt. 2015)
- DAX > SMA 200 (daily)
- World GDP / "World-Stock-Market"
- CECE-Index (in EUR), Dez. 2015
- PE high beta vs. low beta stocks (1986-2015)
- S&P 500 und der WTI-Ölpreis (Korrelation)
- Dow Jones Transportation Index (update April 2015)
- Golden Cross April 2016 (Dow Jones IA)
- Russischer Aktienmarkt (RDX-USD, RTS)
- S&P 500 "the 50s"
- S&P 500 ("the odds")
- SDAX (German Small Caps)
- Dow Jones Industrial Average (Pre-Brexit-Voting)
- Stay cautious!
- DAX-Rollercoaster (03/2012-06/2016)
- S&P 500 Weekly close ("near ATH")
- Dow Jones Ind. Average (2. Jahreshälfte)
- Dow Jones Industrial Average (Renko-Chart)
- EmergingMarkets-Debt-Index
- S&P 600 (Small Caps)
- ATX (Back in the game?)
- S&P 500 (Volume by Price)
- MDAX ( "2002 - 2016" )
- DAX 30 zwischen 8.700 und 11.400 Punkten
- Zickzack-Börsen seit Feb. 2015 (Status: Nov. 2016)
- XLF (Financial Sector / FInancial Sector-ETF)
- Dow Jones Ind. Average (Rep./Democr. President)
- S&P 500-TR vs. DAX-Performance (SPX vs. DAXK)
- Die "magische" 200-Tage-Linie
- 5 years NASDAQ vs. DAX vs. MDAX vs. ATX
- S&P 100 @ 1,000 points (Jan. 2017)
- S&P 500 Rainbow Chart of the "90s"
- Famous Investors, Economists & the DJIA
- S&P 500 Rendite, DJIA seit 1896
- Aktienrückkäufe (Europa)
- Rising Trading Volumes (US-Stock Markets)
- S&P 500 (Under the hood)
- TecDAX (magic 2k, Risiko 12% darunter ?)
- DAX - Sky(high), Neutral, Or Risk-Zone (?)
- DAX vor dem Sommer im Wahljahr 2017
- Dow Jones Industrial Average seit 1897
- Euro steigt, Europas Aktienmärkte steigen (April 2017)
- US-Market & Non-US (Rest of World)
- S&P 500 Global Exposure (IT-Sector)
- Dow Jones Utility Average
- Nasdaq Composite (Momentum-Catch up)
- S&P 500 Seitwärtsphasen ( > 300 Tage)
- S&P 500 @ magic 2,400 - level
- Emerging Markets (magic 1k)
- "Real Indexes" from the year 2000 onwards
- Dow Jones (biggest) Gain contributors 2017 (ytd)
- Stocks versus High-Yield Bonds
- Growth over Value (last years)
- Dosenwachstum 2007 bis 2016
- Dow Jones Industrial Average (Crash 1987)
- DAX und DOW seit dem Jahr 1999 (2017)
- MDAX & Nasdaq-100 (2013 - Nov. 2017)
- Dow Jones Transportation Average (magic 9.5k)
- Dow Jones Transportation Average (ATH)
- "Öl-Index" (WTI-Ölpreis)
- Value Line Geometric Index (ATH)
- 10Year-Treasury-Yield vs. Dow Jones (Ind. Average)
- Stärke im US-Aktienmarkt (Aktien > SMA200-daily)
- Euro Bund-Future (Deutschland)
- The 200 Simple Moving Average (SMA)
- S&P 500 (Technicals, SMA200-daily)
- Bull Market Length (Definition)
- DAX (April 2015 versus 13. März 2018)
- Hexensabbat (4 mal im Jahr)
- US Technology-Index
- "Dow Jones Internet Commerce"-Index
- NASDAQ-monthly (EMAs)
- DAX-Kursindex (Juni 2018)
- Status Quo YEAR-TO-DATE Performance (Jul. 2018)
- Dow Jones US Technology (Index)
- 20 Dow Jones-Werte mit Top-12Monats-Performance !
- The Decade of Low/NO RETURNS (2000 - 2013)
- Schöne Breite am deutschen Aktienmarkt
- Die einfachen Dekaden des Hrn. Buffet
- Dow Jones Ind. Average (4. Okt. 2019) & Fibonacci
- The 200d Simple Moving Average (SMA)
- Momentum is on (Jan. 2020)
- Schöne Breite am US-Aktienmarkt
- Starke Marktbreite am 8. Mai 2020
- Cloud and some Cloud-companies (June 2020)
- (High) Inflation & the US-Stock Market
- Stock Market Returns (ca. 6.75%+ per annum)
- 2022 - one of the worst years
- MSCI World - interessantes Chartbild
Articles
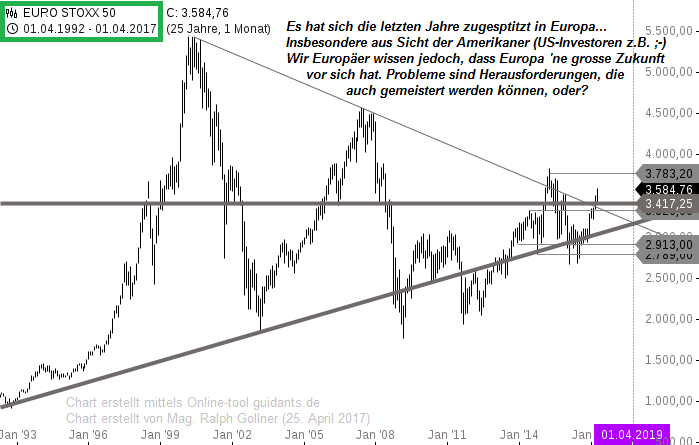
EuroStoxx 50 (April 1992 - April 2017)
EuroStoxx 50
(April 1992 - April 2017)
oder: "Nichts ist unmöglich"

2017-04-25 13:17:27


