Related Categories
Related Articles
Articles
The 200d Simple Moving Average (SMA)
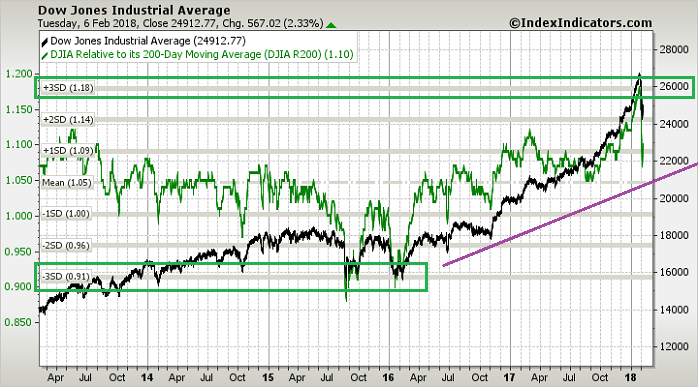
"3 Standard Deviations above/below the SMA200-daily"
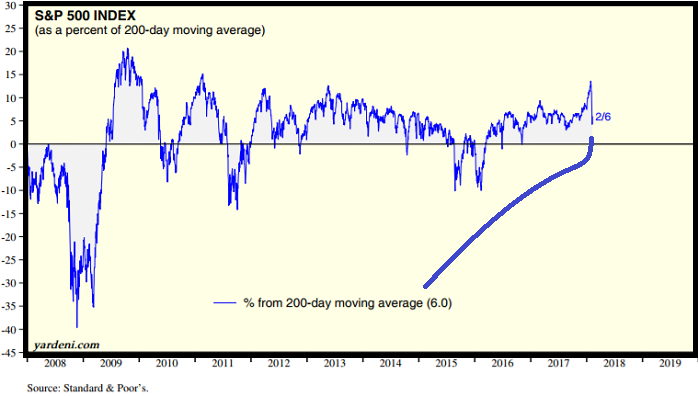
Upfront: Some days ago the Dow Jones Industrial-Average Index-level reached a level, which was in distance of 3 standard deviations from its 200-Day Moving Average (SMA-200). Then, suddenly the Index...
...dropped in an abrupt manner (see chart above). The 200 simple moving average (SMA) is considered a key indicator by traders and market analysts for determining the overall long-term trend. The price level in a market that coincides with the 200 SMA is -as history has proven several times- recognised as a major support when the price is above the 200 SMA or resistance when the price/Index is below the 200 SMA level.
The 200 SMA is particularly popular for application to daily charts. The 200-day SMA, which covers the previous 40 weeks of trading, is commonly used in stock trading to determine the general market trend. As long as a stock's price remains above the 200 SMA on the daily time frame, the stock is generally considered to be in an overall uptrend.

As a very long-term moving average, the 200 SMA is often used in conjunction with other, shorter-term moving averages to show not only the market trend but also to assess the strength of the trend as indicated by the separation between moving average lines. When moving average lines converge, this indicates a lack of definitive market momentum, whereas increasing separation between shorter-term moving averages and longer-term moving averages such as the 200 SMA indicates increasing trend strength and market momentum.
Death Cross
The 200 SMA is considered so critically important that the event of the 50-day SMA crossing to the downside of the 200-day SMA is referred to as a "death cross" signaling a (potential) bear market in a stock, index or other investment. In like fashion, the 50-day SMA crossing over to the upside of the 200-day SMA is called a "golden cross".
In the following chart you see the famous
DOW JONES Industrial Average (incl. SMA-200 and SMA-100), daily updated:
Conclusion
There might be some self-fulfilling prophecy aspect to the 200 SMA; Markets react strongly in relation to it partially just because so many traders and analysts attach so much importance to it...
Link:
Investopedia www.investopedia.com/ask/answers


