Related Categories
Related Articles
Articles
Drawdowns (20year-period)
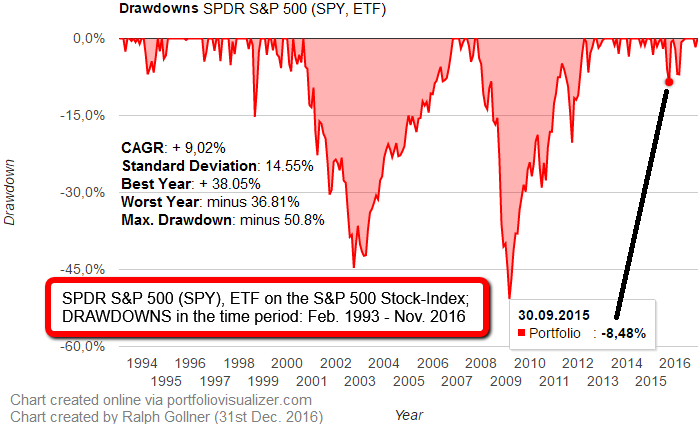
Don't be afraid, it's only a "Drawdown"..."what draws down, goes up again (hopefully)"
I made some Monte-Carlo-Simulation runs and put up some Drawdown-Scenarios, but let´s start with the S&P 500:

a) Based on Statistical Returns (Allocation-Mix: US Stock Market 50%, Developed Markets 45%, Emerging Markets 5%). Monte Carlo simulation results for 10,000 portfolios using available asset class data from 1995 to 2015. The historical return for the selected allocation from 1995 to 2015 was 9.05% mean return.

b) Based on assumed returns of 9.5% (US Stock Market 50%, Developed Markets 45%, Emerging Markets 5%) you will find following Monte Carlo simulation-Drawdown-results for 10,000 portfolios using available asset class data from 1995 to 2015:

Please also check out the historical data (S&P 500 returns) and quick n dirty analysis in the recent postings on this website; Therefore please type in www.private-investment.at/posts/view/xyz - where "xyz" should be replaced by one of the following posting-numbers:
# 298 and
# 386
Extremely great link on "What's Drawdown": www.styleadvisor.com/maximum-drawdown
Monte-Carlo Definition: www.palisade.com/risk/monte_carlo
Short Video from a Pro on "Drawdown" / Definition: www.styleadvisor.com/quick_tip_video.wmv


