Related Categories
Related Articles
Articles
TEMPORARY Market losses are the one constant that...
...don't change over time - get used to it !
"One needs to show" what the distributions of stock returns are over time. This paraphrased recommendation was given by University of Chicago professor Eugene Fama at a CFA...

...Chicago Society event held in June 2017. The comment was in reference to what happens to returns the longer an investor remains allocated to stocks.
Just as a short reminder: In 2013, Eugene Fama shared the Nobel Memorial Prize in Economic Sciences jointly with Robert Shiller and Lars Peter Hansen. The Research Papers in Economics project ranked him as the seventh-most influential economist of all-time based on his academic contributions.
Fama was specifically referencing the historical distribution of returns - a bell curve. For those of you less familiar with statistics, a bell curve plots out a group of data. Think of it as a valley followed by a hill followed another valley. To the extent data points are within a normal range, they are bunched up, forming a hill (the "bell"). The valleys are the outlying low ("left tail") and high ("right tail") values.
In simple, the outcome of the bell curve for Stock-Market returns can be summarized: The longer an exposure to stocks has been maintained, the more likely positive outcomes occurred and the closer the outlying returns were to the typical range. Put another way, if you look at your portfolio only very occasionally, you’ll more likely notice both gains and less volatility.
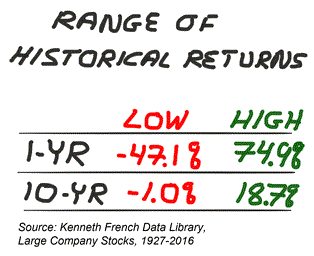
An equal-weighted portfolio of the largest 30% of exchange-listed stocks averaged a 12.5% annual return between 1927 and 2016, based on data from Kenneth French's website. The worst return was -47.1% (1931), while the largest return was 74.9% (1933). There were 11 years when losses exceeded 10% (seven in excess of 20%) and 31 years when gains exceed 20% (17 in excess of 30%) - a lot of variance.
If we extend the period to five years, the variance of returns narrows. Annualized returns averaged 10.5%.
Going out to 10 years, the variance is even less and the odds of having made money greatly improved. The worst return was -1.0% (technically -0.95% between 1928 and 1937), while the largest return was 18.7% (1949-1958). There were only two 10-year periods when annualized were negative (1928-1937 and 1929-1938). Again, the left tail continued to move right, while the overall range of returns was even smaller.

This data tells you a few things. First, the less you look at your portfolio's performance, the less volatile your equity allocation will seem. Second, the odds of realizing a positive return greatly improve with time. Third, the risk of a loss does not fully go away, though the magnitude of any loss shrinks with time. Combined, the data favors a long-term commitment to equities along with lessfrustration about the day-to-day, month-to-month or even year-to-year returns.
A lot of things have happened in the last decades, centuries. Many changes have taken place in the stock market over the years - the creation of the Fed, monetary policy, fiscal policy, the end of the gold standard, tax rates, valuations, the industry make-up of the markets and a number of other things.
But there has been one constant going back all the way to the early 1800s - risk. More specifically, drawdowns or losses. Obviously the crash during the Great Depression stands out in the following chart, but look at how consistent losses have been over each and every decade or economic environment. Losses are really the one constant across all cycles.

Stocks don't make new highs every single day, so most of the time you’re going to be underwater from your portfolio's high water mark. This means there are plenty of chances to be in a state of regret when investing in stocks.
The majority of your time invested in stocks could be spent thinking about how you coulda, shoulda, woulda sold at that previous high price (which of course gets taken out to the upside eventually). Here's the further breakdown by the size of the loss:

Over the last 90 years or so the market have been in a bear market almost one-quarter of the time. Half the time you're down 5% or worse. It’s difficult to appreciate this fact when looking at a long-term log scale stock chart that seems to only go up and to the right (e.g. Dow Jones Industrial Average, S&P 500). This is why stocks are constantly playing mind games with us. They generally go up but not every day, week, month or year.
No one can predict what the future returns will be in the market. No one knows what the future holds for economic growth. And we certainly can’t predict how investors will decide to price corporate cash flows at any given point in time out into the future.
But predicting future risk is fairly easy - markets will continue to fluctuate and experience losses on a regular basis. As an investor in stocks you will spend a lot of time second-guessing yourself because your portfolio has fallen in value from a previously seen higher level. In a sense risk is easier to predict than returns.
Let's repeat together: Market losses are the one constant that don't change over time - get used to it.
links:
http://awealthofcommonsense.com/2016/04


