Related Categories
Related Articles
Articles
Fear & Greed Index (three indicators selected)
post Brexit (26th June 2016)
Investors are driven by two emotions: fear and greed. Too much fear can sink stocks well below where they should be. So what emotion is driving the market now? CNNMoney's Fear & Greed index makes it clear.
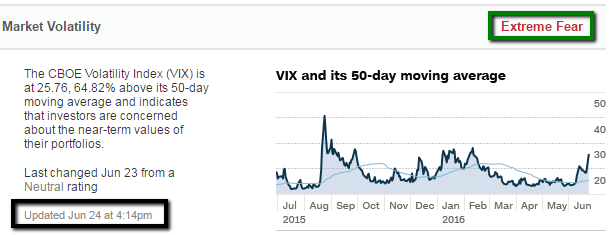
They look at 7 indicators; here is a selection of three indicators which they are following closely and are now in Extreme-Fear-territory (see chart above and charts below):

Looking at the indicator "S&P 500 versus its 125-day moving average", the definition says, that if the Index lies SLIGHTLY above this level, the stock-market-index is neither in Extreme-Fear nor Extreme-Greed territory, but still - beeing in neutral territory - any slight dip below that moving-average line or even a strong one-day move BELOW this threshold line in the near future may give special signals to various investors: "Buy the dip" versus "Sell the drama", etc.
The S&P 500 is currently 1.11% above its 125-day average (as per Fridays' market close, 24th June 2016). During the last two years, the S&P 500 has typically been further above this average than it is now, indicating that investors are committing capital to the market at a slower rate than they had been previously. The status on this indicator last changed on 23rd June 2016 from an Extreme Greed rating to Fear.
Direct link to the whole set of the 7 indicators used for the CNNMoney FEAR & GREED Index:


