Related Categories
Related Articles
Articles
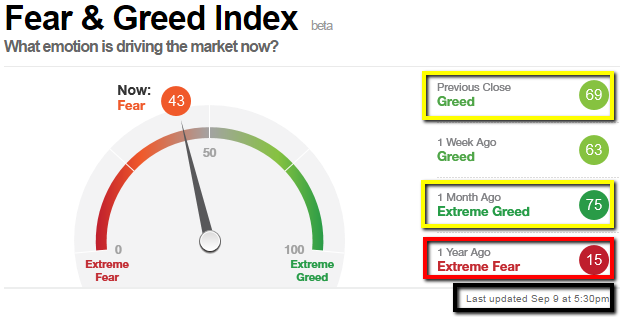
Fear & Greed (43 versus 69)
Now, that the Fear & Greed Index of http://money.cnn.com/data/fear-and-greed has fallen below the "50-points-threshold" this could give the markets the chance to breathe through for regaining momentum for the later months of the year 2016.

As can be seen from the screenshot above, the level of 43 is well below the readings of the weeks in August 2016 before, while the S&P 500 was at a level above 2,150 points. Now, that the US-Stock-Index has fallen BELOW its 2,150 points-threshold AND the Fear & Greed Index is below the 50-level there might be room for consolidation (time-wise and point-wise to the downside).
But one should keep in mind, that since Q4-2014 (marking the end of the US Quantitative-Easing period) the markets experienced several V-shaped recoveries after initial sudden (sharp) stock-market-drops.
Furthermore, one can notice, that 1 year ago (famously in an Aug. - Oct. period) the Fear & Greed-gauge was also at a low level indicating even "Extreme Fear" (< 25). It is therefore absolutely no scarce occurence to see higher volatility accompanied by high(er) fear-levels in that special period of the year (late summer, early autumn).


