Related Categories
Related Articles
Articles
Dividend Discount Model S&P 500
(potential fair valuation)
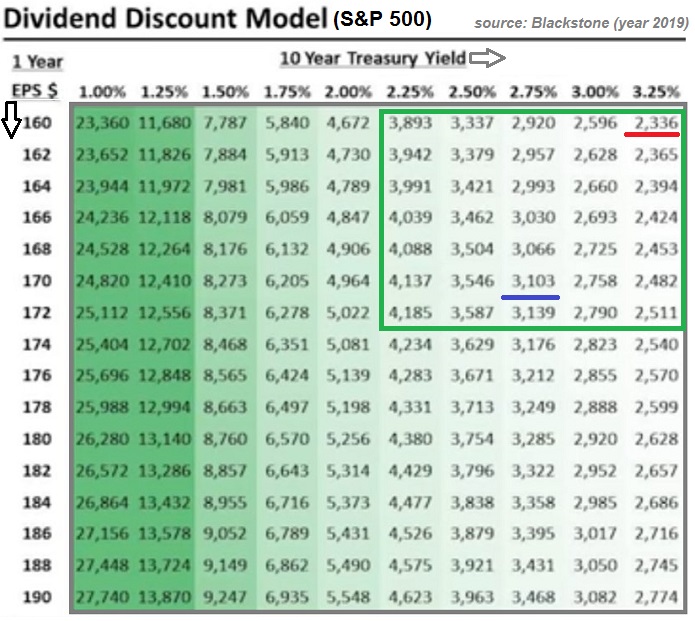
In Oct. and November 2018 the U.S. 10Year-Treasuries reached a yield of ca. 3.25%. Around Christmas Eve the S&P 500 reached then its intermediary LOW at around a level of ca. 2,336 points...(I did not look up the exact level).

Just by coincident, that level would be confirmed by the DDM-matrix cross-section of 3,25% (10YR-Treas.) and an EPS-level of ca. 160 USD per S&P 500.
"DDM = Dividend Discount Model"
"SPX = S&P 500 / U.S. Stock-Market Index" (see following chart)
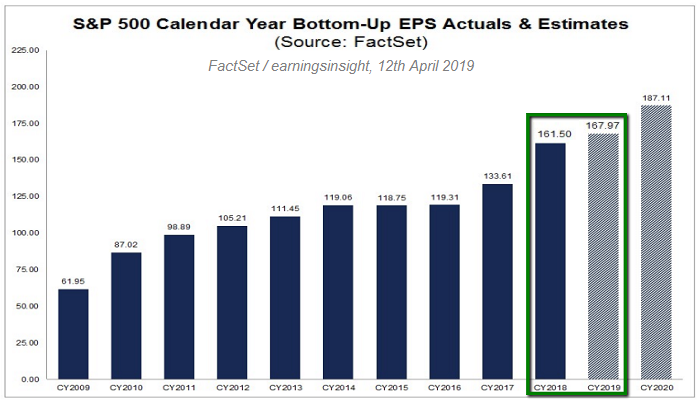
Now that we are sitting at a 10YR-Treas.-level of ca. 2.50% and a possible S&P 500 earnings-"guess" of ca. 168 USD (see Matrix above and FactSet-estimates in the barchart below) one would reach a potential intersection-point of ca. 3,504 points in the S&P 500 (see Matrix above).
>> Well, far above the current level of ca. 2,907 points. To be exact, this would imply an upside-potential of ca. +20.5% in the U.S. Stock Market; Unbelievable, but true...

Just for cross-check reasons I made a quickNdirty Cash-Flow Valuation of some of the most relevant DOW-Jones components and reached the conclusion, that also the old DOW-Jones Index has a potential of more than 20% plus within the next quarters - therefore easily crossing the magic 30k-line...
(Currently the Dow Jones Industrial Average is sitting at 26,412 point as per market close of Friday, 12th April 2019).
WoW - Low interest rates (and bond yields) can really have a big impact on Stock-Market valuations, aka: FAT TAILWIND.
cheers Ralph


