Related Categories
Related Articles
Articles
A short "reminder" on US-Treasuries (10 year T-Bond)
& US-Equities-Valuation
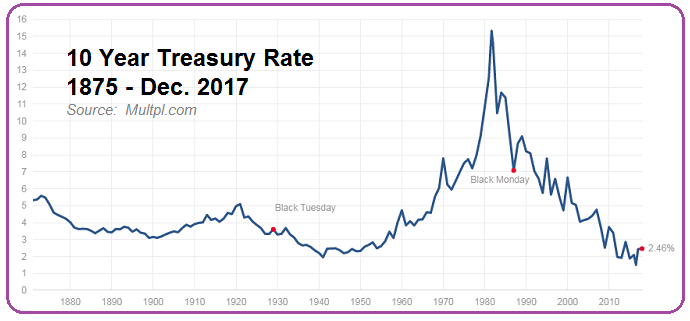
♦ Average 10 year T-Bond yield since the year 1871 is ca. 4.6% (Status Q4-2016)
♦ Maximum 10 year T-Bond yield since 1871 is 15.3% (September of 1981)
♦ Current 10 year T-Bond yield...

...is 2.497% (as per 20th Dec. 2017, Intraday)
Some theory: In theory lower interest rates cause asset prices (including stock prices) to rise. Here's how: Imagine a stock yields 4% and T-Bonds yield 8%. If T-Bond yields drop to 4%, the stock's yield will look comparatively attractive. "Normally" Investors will pile on and bid up the share price, reducing the stock's yield back to equilibrium with the T-Bond yield.
If theory holds true, it stands to reason that the S&P 500 will have a higher price-to-earnings multiple on average when interest rates are lower. But at what level should the price-to-earnings ratio stand? Is the market really overvalued given today's low interest rate environment?
As a reminder: Interest rates are controlled by the Federal Reserve. The Federal Reserve's primary tool in setting interest rates is controlling the Federal Funds Rate. The Federal Funds Rate is the rate at which banks lend funds held at the Federal Reserve to each other on a short-term (overnight) basis. The Federal Funds rate (therefore) indirectly determines borrowing rates for the entire United States economy!
Theory leads us to the logic conclusion, that we could explore the correlation of the stock market's price-to-earnings multiple with 10 Year T-Bond yields in the modern financial era; since the United States abandoned the gold standard in the year 1971.
There should be a clear inverse relationship between the market’s valuation multiple and interest rates. The higher interest rates go, the lower the S&P 500's valuation multiple, all other things being equal.
(But) What's a Fair Valuation Today?
What is a fair price-to-earnings ratio for the S&P 500 today given these low interest rates? Running a linear regression on the data PE-Ratio and Interest Rates in the last decades gives a linear Regression; In the following Picture the relation can be seen:

Remark on the current PE-Valuation scenery
Is the market overvalued based on an absolute historical basis? It seems so, BUT: Is the market overvalued given current ultra-low interest rates? Well, does not like quite so...Given the current low-interest rate environment in the industrialised economies, the US-Stock Market could be currently even trading around fair value !
Logic outcome: Given the current artificially low interest rate environment (Fed funds rate still below 2%; 10-year T-Bond below 3%), and that the artificially low interest rate environment will likely be with us for the next 6 to 9 months a PE-ratio, BASED on expected earnings for the year 2018, of ca. 18 to 19 looks to be manageable.
Then there goes the magic question on the earnings-numbers of the S&P 500 in the year 2019 (but also of course the year 2018). In the end several analysts and forecasts point to the possibility that the companies in the index may achieve a cumulative S&P 500-earnings-number of 160 USD in the year 2019. Applying a PE-multiple of ca. 18.5 to that number would lift the S&P 500 to an index-level of ca. 2,960 points within the year 2018 (160 x 18.5).
According to FactSet one can currently (estimate as per 8th Dec. 2017) read earnings-estimates for the year 2019 at a level of ca. 160 USD.
Furthermore (context between Fed fund rates & Inflation numbers): In the context of the inflation outlook in the U.S. and the developed world, there appears to be less risk for earnings multiples in the short term. Historically, zero to 2% inflation has remained the sweet spot for valuations.
AND DO NOT FORGET about the TAX-effect in the eqation (boosting potential earnings - in the formula in the year 2019). Potential: stock buybacks, debt-paybacks !
link:
www.multpl.com
Data/Graph-Source:
www.suredividend.com/interest-rates-valuation


