Related Categories
Related Articles
Articles
S&P 500 Fair Value in the year 2022 and 2023
The foundational paper on valuation that professors Merton Miller and Franco Modigliani (M&M) wrote in 1961. In it, they addressed a fundamental question: "What does the market ‘really’ capitalize?" They did not crown a winner...

...among approaches that rely on earnings, dividends, or cash flows. Rather, they showed that all of these methods yield the same result if you address the problem correctly.
In the section that demonstrates this theoretical equivalence, M&M offer a formula that is very helpful for investors. They say that you can separate the value of a company into two parts:
Value of the firm = steady-state value + future value creation
The equation allows you to disaggregate a price-earnings multiple into a commodity component (the first term) and a franchise component (the second term). This lets you understand how much you are paying for future value creation.
The steady-state value of a firm is the worth of the business assuming that it maintains its normalized level of
NOPAT into perpetuity.
Component I: The Steady-State Value
----------------------------------------------
A Company arrives at its steady-state value when its incremental investments earn the cost of capital. With the second term of the equation collapsed to zero, all of the firm’s value falls on the steady state.
FORMULA =
Steady-state price-earnings multiple =
1 / Cost of equity
As of the beginning of 2014, Aswath Damodaran, a professor of finance at New York University's Stern School of Business, estimated the cost of equity in the United States to be 8 percent (Me, Ralph Gollner, I cross-checked that number and did my own research with most current figures of all S&P 500 companies: Satisfying enough I arrived at a similar figure - 8% now in January 2022)!
>> This translates into a steady-state price-earnings multiple of 12.5 times.
Simplistically, we can say that the market expects a company to create shareholder value if its stock trades at above 12.5 times current earnings. If the stock trades below that multiple, the market is assuming either no value creation or that future value creation will be insufficient to offset a decline in the current base business. In other words, current earnings are unsustainable.
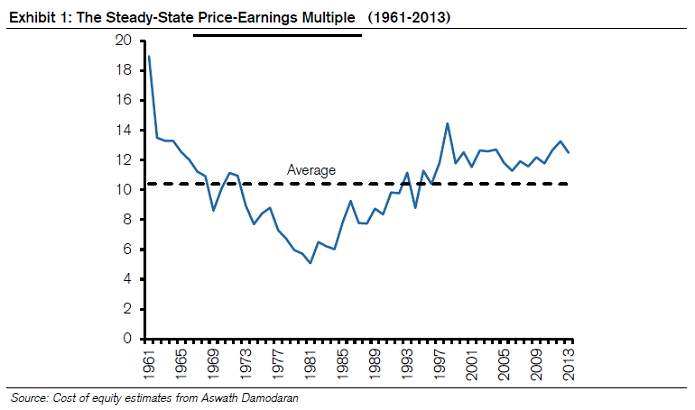
The following Exhibit shows the appropriate steady-state price-earnings multiple from 1961 through the end of 2013. The multiple started in the high teens in the early 1960s, a period when the cost of equity was low. It then had a steady march downward as both interest rates and the equity risk premium rose, bottoming at just over 5 times in 1981. Consistent with bull markets in both bonds and stocks, the steady-state price-earnings multiple ascended, with a peak in the late 1990s. Over the full period (1961 til the year 2013), the average multiple was ca. 10.5 times.

Careful consideration of the Exhibit 1 above can help frame discussions about the appropriate price-earnings multiple, both on an absolute basis and relative to history. Price-earnings multiples are a product of a multitude of factors, including interest rates, inflation expectations, the equity risk premium (itself influenced by sentiment / BEHAVIORAL FINANCE), the business cycle, tax rates, the QUALITY of earnings, GROWTH prospects, and investment opportunities.
To the degree to which those factors change over time, it stands to reason that the appropriate multiple will change as well. For this reason, appeals to history should be approached with caution.
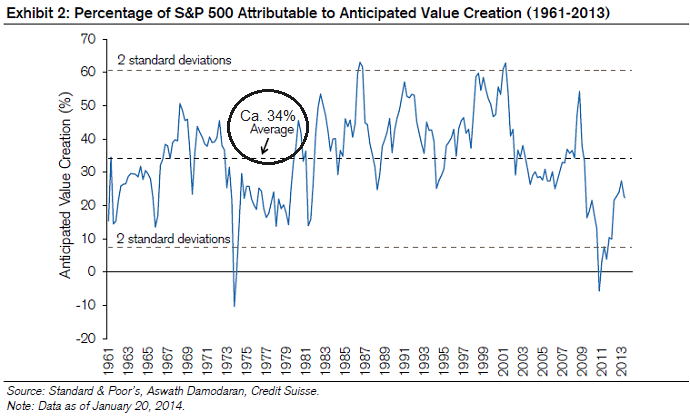
Since 1961, the steady-state value has explained about two-thirds of the market's value, on average, and anticipated value creation has explained the other third (see Exhibit 2). We calculate this by taking the annual earnings number for the S&P 500, capitalizing it by the cost of equity, and subtracting the result from the S&P 500 price level.
For example, the annual earnings for the year 2022 might reach $ 225 (after $ 210 in the year before) and the cost of equity was ca. 8 percent, generating a steady-state value of 2,812.50 for the S&P 500. The index closed at circa 4.400 points.
This means that the steady state was 63 % of the value and that anticipated value creation was the other 37 %.

Looking at the extremely low interest rates, one could argue for a transitory level for the Cost of Capital of 6% versus the standard 8% used.
>>>
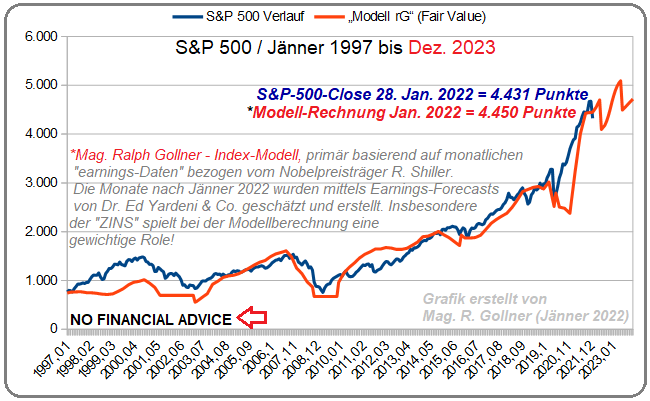
This is in fact the input I used for my model in the S&P-500 Fair Value-computation in the graph I posted at the beginning of this posting. I furthermore plotted the expected monthly earnings for the period 2022 until December 2023 in order to arrive at a theoretic (!) Index-evolution for the upcoming 23 months! The computation should NOT be confused with a forecast or even a recommendation to buy or sell equities!
helpful link:
http://www.econ.yale.edu/~shiller/data.htm


