Related Categories
Related Articles
Articles
Shiller PE (1881 - 2016)
One of the primary weapons that rational bubblers use to back up their case is the Cyclically Adjusted Price Earnings (CAPE), a measure developed and popularized by Robert Shiller, Nobel prize winner...

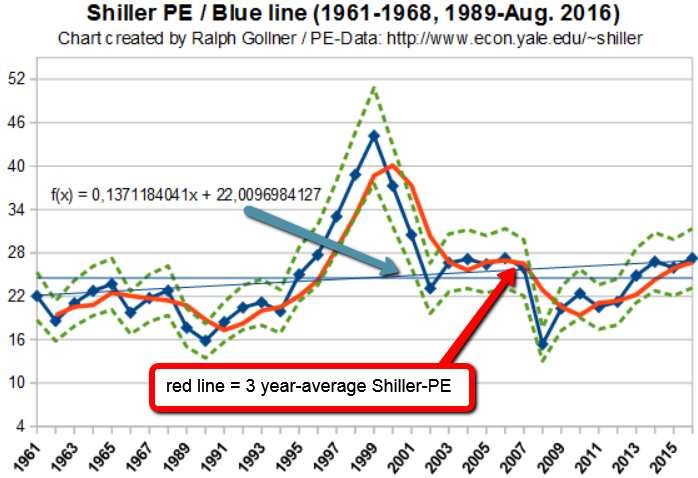
...whose soothsaying credentials were amplified by his calls on the dot com and housing bubbles. For those who don’t quite grasp what the CAPE is, it is the conventional PE ratio for stocks, with two adjustments to the earnings. First, instead of using the most recent year’s earnings, it is computed as the average earnings over the prior ten years. Second, to allow for the effects of inflation, the earnings in prior years is adjusted for inflation. The CAPE case against stocks is a simple one to make and it is best seen by graphing Shiller’s version of it over time.

The current CAPE of 27.27 is well above the historic Longterm-average. How did the CAPE evolve since the 19th century? Well, take a look at this REAL LONG-TERM chart from 1881 onwards:

Shiller-PE data-series: http://www.econ.yale.edu/~shiller/data.htm
Aswath D. - article: www.valuewalk.com/2016/08/sp-500-cape


