Related Categories
Related Articles
- Valuing Wall Street: Protecting Wealth
- Tobin's Q
- Global Valuation CAPE & Price-Book (selection)
- Shiller PE-Ratio (Feb. 2016) vs. S&P 500/Market Timing
- Price-Book-Value S&P 500 (history)
- Abweichung vom MEDIAN-Gewinn-KGV
- CAPE/Shiller-KGV (Jan. 2016)
- Magic Formula Investing (Joel Greenblatt)
- Valuation NYSE / Morningstar Tool
- Berkshire Hathaway (P/B-Valuation)
- EPS & S&P 500 (1988-2015)
- The Fed Model
- S&P 500 earnings (actuals & estimates, I/B/E/S)
- Rule of 20 (PE of 18.9 ok ?!)
- S&P500 dividend yield vs. 30-year U.S Treasury bond
- Dax-Kurs-Buchwert-Verhätnis (Juni 2016)
- DAX-Kursindex versus Kurs-Buchwert
- S&P 500, ROE & Price/Book-Ratio
- S&P 500 (Trailing Twelve Month Earnings)
- Cape Ratio vs. TBOND-Ratio
- Shiller PE (1881 - 2016)
- S&P 500 Forecast (2015, 2016)
- NIPA-Profits (S&P 500-PE-Ratio / Jeremy Siegel)
- Valuation S&P 500 (quick n dirty)
- S&P 500 ("fair") Valuation
- Cash Flow makes the world go around (S&P 500)
- DAX-Bewertung, EM-Bewertung (Q4-2016)
- Emerging Markets (Valuation)
- DAX bei KGV 29 (freaky...)
- DAX-Bewertung 1988-2010 (& beyond)
- Price-Sales-Ratio (P/S-Ratio), 1999 vs. 2015
- DAX-Rollierende 12-Monats-Entwicklung & Buchwert
- Kurs-Buchwert Europa-Aktien vs. US-Stocks
- Earnings Yield vs. Bond Yield ("Fair Valuation")
- Bewertung "Anleihen versus Aktien"
- DAX-Dividendenrendite versus...
- Bewertung Europa-Aktien versus US-Aktien
- S&P 500 Valuation (HY2 / 2017)
- Free Cash Flow (Yield)
- DAX - Bewertungsbänder
- Biotech (risky sector, but LT-prospects)
- Value - "Comeback" (?)
- y2k Tech-Bubble Peak versus US-Stock Market
- S&P 500 earnings (growth)
- MOAT, then management, but ALWAYS: Price
- Cash Flow Yield
- US-10 year T-Bond & US-Equities-Valuation
- S&P 500 Forward PE (and IT ; -)
- Mögliche DAX Renditen (2018 bis 2026 / 2031)
- S&P 500 - Index-earnings (April 2018)
- PE-Ratio NASDAQ-100 (July 2018)
- S&P 500 Fair Value (Based on Fwd-Earnings)
- Price-Earnings Ratio S&P 500 (PE-Ratio S&P 500)
- Austrian Stock Market (Valuation / PE-Ratio)
- DD-Model (S&P 500, earnings & 10YR-treasuries)
- DDM S&P 500 (May 2019)
- Dekaden (Fokus: 1950 - 2019)
- Valuation matters (2019 versus 1999)
- Dividend Discount Model S&P 500 (potential fair value)
- DAX-Stand von unter 10.000 (13. März 2020)
- Valuation US-Stock-Market (March 2020)
- Fed Balance sheet and the S&P 500 (April 2020)
- Free Cash Flow (ADBE, AMZN, FB, NVDA, PYPL)
- Excess CAPE Yield (ECY)
- DAX-Potenzial im Jahr 2022
- S&P 500 "Fair-Value Model" (Cost of Capital ca. 8%)
Articles
US-Stocks (Valuation-History)
US-Stocks (Valuation-History up to 2015)
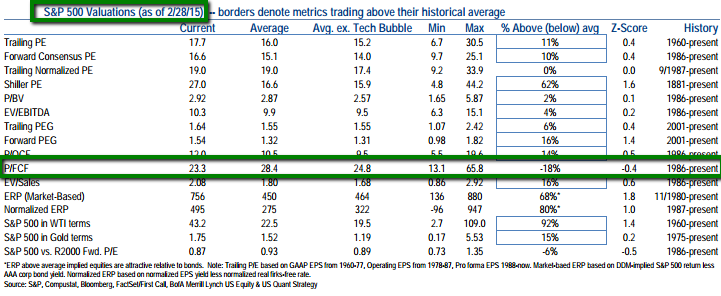
Price/FCF historical average (1986 - 2015) / Average EXCL. Tech Bubble: 24.8 (Valuation as per Feb. 2015: 23.3);
It may also be of interest to know, that the S&P 500-Index stood slightly above 2,100 points on the 27th Feb. 2015.
 source re. Price/Free-Cash-Flow, etc. - History (S&P 500): http://www.merrilledge.com
EV/EBITDA-History (S&P 500): http://www.zerohedge.com
EV/EBITDA per company: http://www.infinancials.com/
2015-12-20 23:11:09


