Related Categories
Related Articles
Articles
Remember the Big Bull Markets (50s, 90s)
I guess, the times to achieve great returns via Value-Investing are now much harder than in the last century...maybe, BUT: there always has to be an Equity Premium OVER Bond-yields! (my best guess)

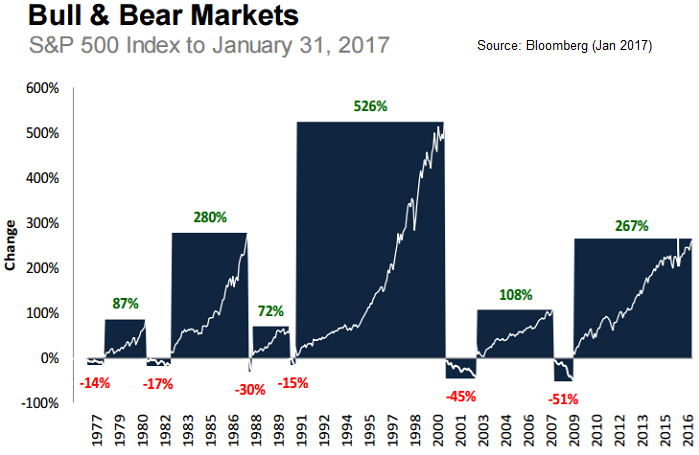
For the purposes of this illustration, a bull (bear) market is defined as a positive (negative) move greater than 15% that lasts at least 3 months in the chart above (Period: 1977 - 2016).
Statistics-source First Trust/
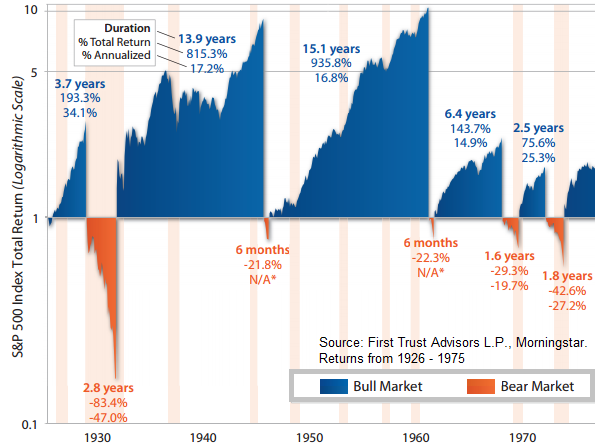
Max. Bull Period in the 30s and 40s: 13.9 years, +815.3%, Annualized: 17.2%
50s: 15,1 years, +935.8%, Annualized: 16.8% ("Warren Buffets' starting years" - *LUCKY U* )
end of 70s, 80s: 12.9 years, +845.2%, Annualized: 19%
end of 80s, 90s: 12.8 years, +816.5%, Annualized: 19%
The following chart shows the historical performance of the S&P 500 Index throughout the U.S. Bull and Bear Markets from 1926 through 1975. Although past performance is no guarantee of future results, looking at the history of the market's expansions and recessions helps to gain a fresh perspective on the benefits of investing for the long-term (the shaded areas indicate recessions):

♦ The average Bull Market period lasted 8.9 years - with an average cumulative total return of 490%.
♦ The average Bear Market period lasted 1.3 years - with an average cumulative loss of -41%
links:
.pdf www.ftportfolios.com


